Analyzing Tree Cover Patterns Around Settlements in the Rumphi District, Malawi
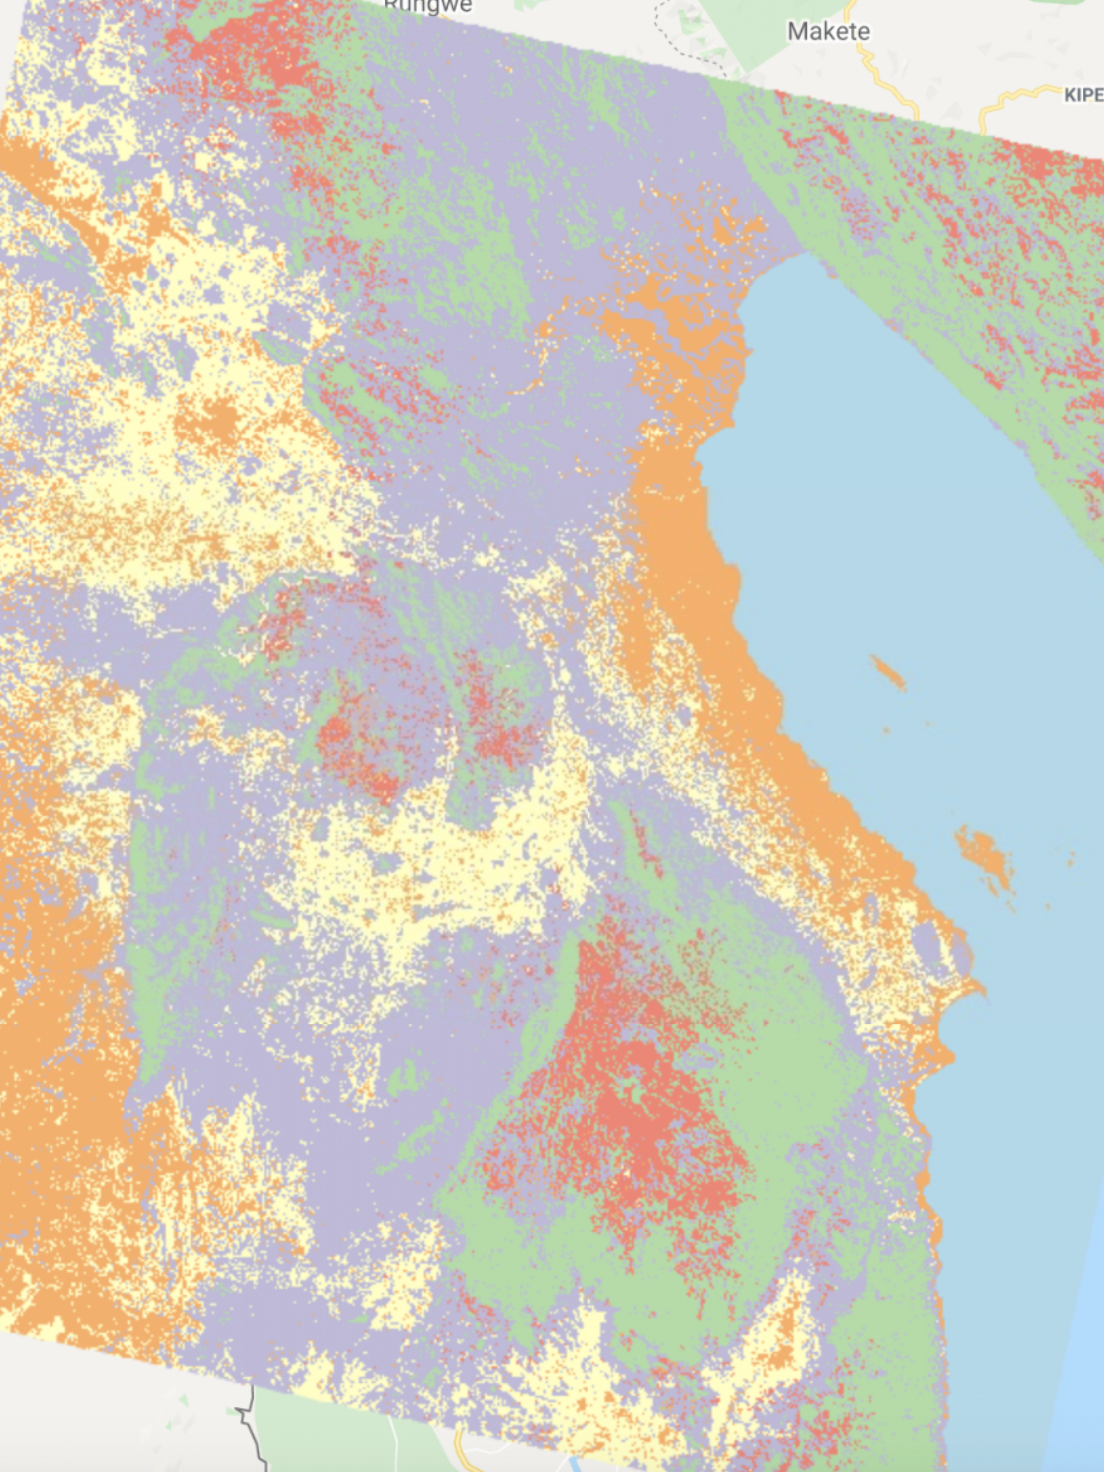
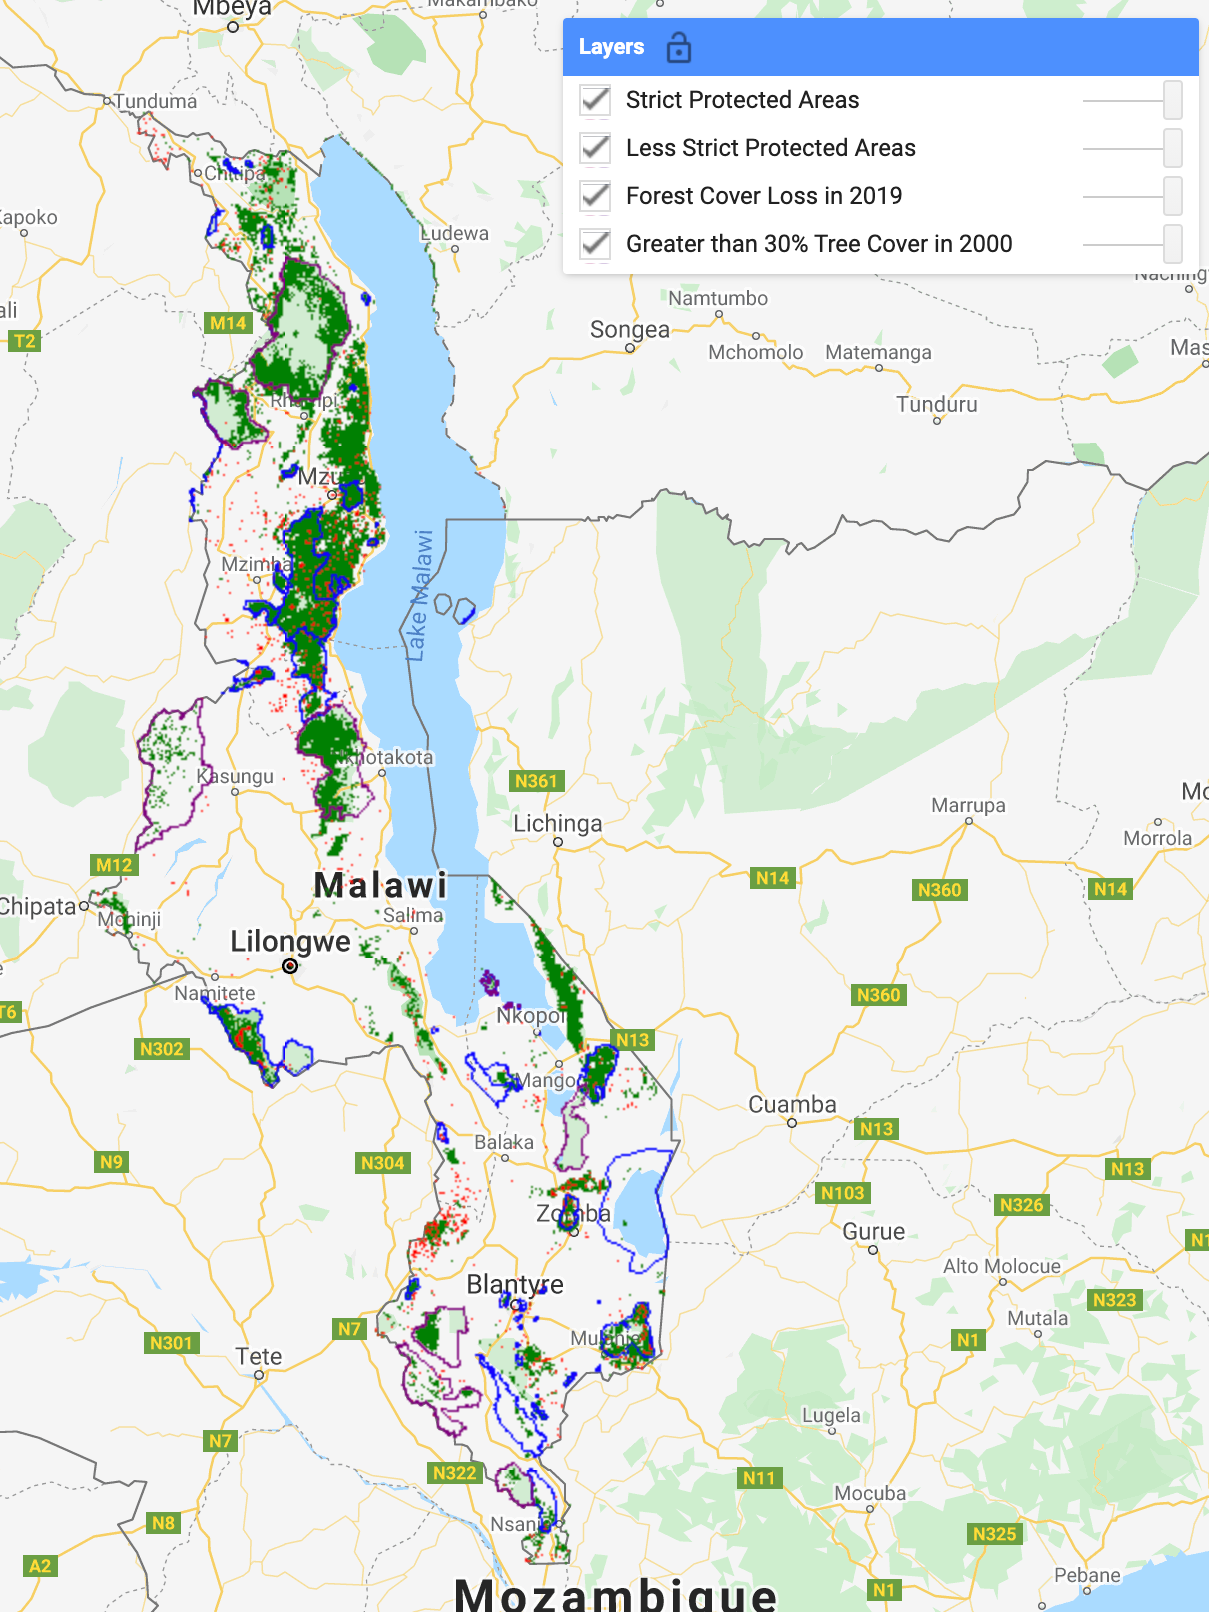
This problem explores the question of how trees are distributed relative to “built-up” areas in the study area of the Rumphi District in Northern Malawi (Figure 3). Built-up areas entail developed land such as residential and commercial areas. For this analysis, I looked at the total area of tree cover in concentric circle-regions centered at 50 points identified as built-up. The regions I evaluated were 300 meters away from the point, then 300-500 meters, 500-1000 meters, 1000-1500 meters, 1500-2000 meters, 2000-5000 meters, and 5000-10,000 meters (Figure 1). I then review existing literature in attempt to explain the findings, and propose alternative steps that could improve the analysis. This analysis is important in evaluating how various livelihoods contribute to land cover change and can be useful in aiding predictions of future land use trends.
Figure 1) The built-up area points and their respective regions. The smallest region (300 meters away from the point) is shown in dark pink, then 300-500 meters in yellow, 500-1000 meters in green, 1000-1500 meters in blue, 1500-2000 meters in orange, 2000-5000 meters in purple, and 5000-10,000 meters is shown in light pink. The code for the construction of these buffers is found on lines 17-38 of this Google Earth Engine script.
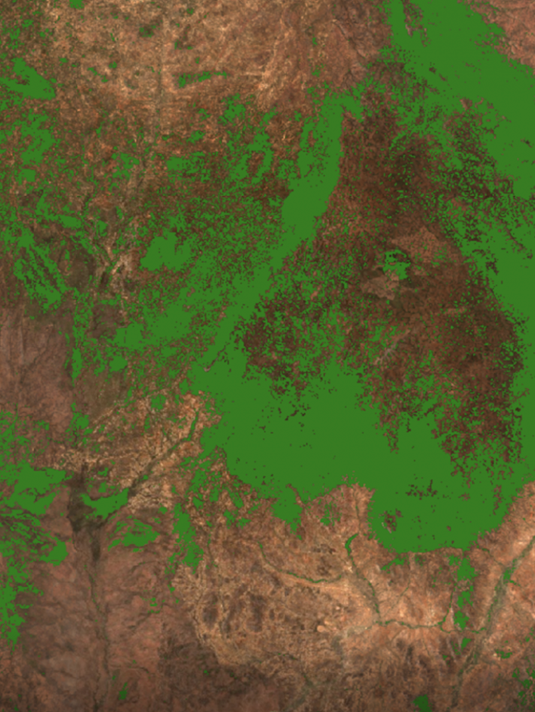
Examples of built-up points.
According to this analysis, tree cover increases the farther away we get from settlements. Figure 2 shows there is, comparatively, little tree cover until region 4 (the 1,000-2,000 meter range, containing a total tree cover of 16,173,388 meters²), after which there is an exponential increase, with 142,258,717 meters² total in the 2,000-5000 meter range, which jumps to 475,874,159 meters² total in the 5,000-10,000 meter region.
Figure 2) This graph shows the total area of tree cover per region, illustrating an exponential increase after region 4. The code to create this graph is found in lines 71-82 of this Google Earth Engine script.
The observed patterns may be due to the fact that wood usage and agriculture are integral parts of the livelihoods in the region. Interviews in the Mwasizi area (Figure 3) found that 80.7% depend on agriculture (largely maize farming) to support their daily livelihoods, which necessitates the clearing of land (Ngwira & Watanabe). Munthali et al. states, “deforestation is rampant … due to increased demands for fuelwood, charcoal, burnt bricks, tobacco curing, and new farm lands is due [partially] to the burgeoning population.” As a staple cash crop, the government encourages tobacco farming and it is grown by 45.4% of households in the Rumphi area. Tobacco growing is a form of contract farming, which provides smallholder farmers access to markets, inputs, and extension services which has caused a surge in tobacco farmers. Tobacco is the highest user of wood outside households, followed by the brick construction which relies on wood energy for production. There are various underlying driving factors that lead to these practices including but not limited to poverty, population growth, expensive alternative building materials, and lack of awareness and resources (Ngwira & Watanabe). It is clear that people in the Rumphi district rely on wood not only for fuel in the household, but to sustain their livelihoods, which may be the reason for the lack of tree cover near built-up areas.
Figure 3) The study area.
Figure 4) A close up look at a built-up point near the city of Bwati. As you can see, there are many agricultural plots in the regions near the point.
Given the way this analysis was conducted, it is unsurprising that tree cover rises exponentially as we progress further out in our concentric circle regions. This is because of the increased size of the regions as we get farther from the built-up points. We begin with a small area spanning 300 meters from the built-up areas, but as we continue outward these regions grow in size; the largest area being a 5000 meter-wide ring (Figure 4). This is obvious when visualizing these concentric rings — the rings grow in width as we expand outward away from the points. Thus, it follows that it is likely for there to be more trees in a region with a larger area. It may be true that there are more trees far from built areas, but it is likely that this number is skewed due to the larger further regions. To improve this analysis, the tree area within each region needs to be normalized by looking at trees per square kilometer, so that the value is comparable. This entails calculating the area of each region, then dividing the tree cover of each region by the area. Then, creating a graph that compares these new normalized numbers may provide better insight into the distribution of trees around built-up areas.
Figure 5) The concentric circle regions of the analysis. It is clear that the area of the final two regions is much larger due to the inconsistent width size of the circles.
This analysis indicates that total tree cover is lower near built-up areas compared to farther regions, which aligns with the findings of pre-existing studies of the area. However, this analysis would benefit from a normalization of tree cover per region so the total area is comparable across regions. It would also be interesting in future studies to look at the roles protected areas play, as well as to take into account the size of the settlement.
Sources:
Munthali et al. “Smallholder farmers perception on climate change in Rumphi District, Malawi.” Journal of Agricultural Extension and Rural Development, vol. 8, no. 10, pp. 202-120. Aug 3, 2016. DOI: 10.5897/JAERD2016.0798
Ngwira, Susan and Teiji Watanabe. “An Analysis of the Causes of Deforestation in Malawi: A Case of Mwasizi.” Land, vol. 3, no. 48, pp. 1-15. Mar 15, 2019. DOI:10.3390/land8030048


